

Market Watch · July 2026
July is always the quietest month of the year. This year is no exception. But look past the summer slowdown and the year-over-year story is worth paying attention to.
July closings reflect homes that went under contract in late May and June, right in the heart of summer vacation season. Buyers take longer to decide, sellers take longer to negotiate, and the whole market exhales for a few weeks. That's normal, it's expected, and it's not a signal about where the market is headed.
What is a signal: the year-over-year comparison, which filters out all of that seasonal noise and shows you where demand is actually moving.
Here's the full breakdown by city, month over month, June vs July 2026
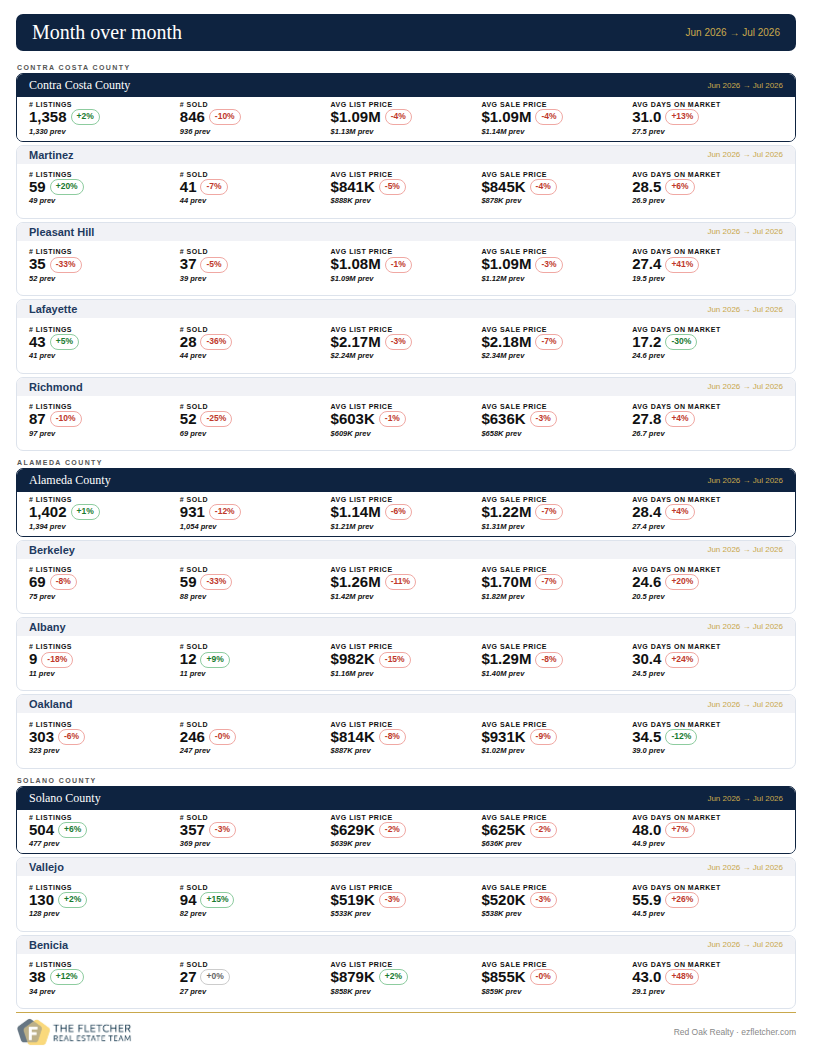
Month Over Month: June → July 2026
As expected, the summer slowdown showed up across all three counties. Sales were down 10% in Contra Costa, 12% in Alameda, and 3% in Solano. Prices eased modestly, days on market ticked up. The one bright spot was Lafayette, where days on market actually dropped 30% and sales held relatively steady. Luxury buyers who are active in July tend to be serious.
And here is the year-over-year comparison, July 2025 vs July 2026
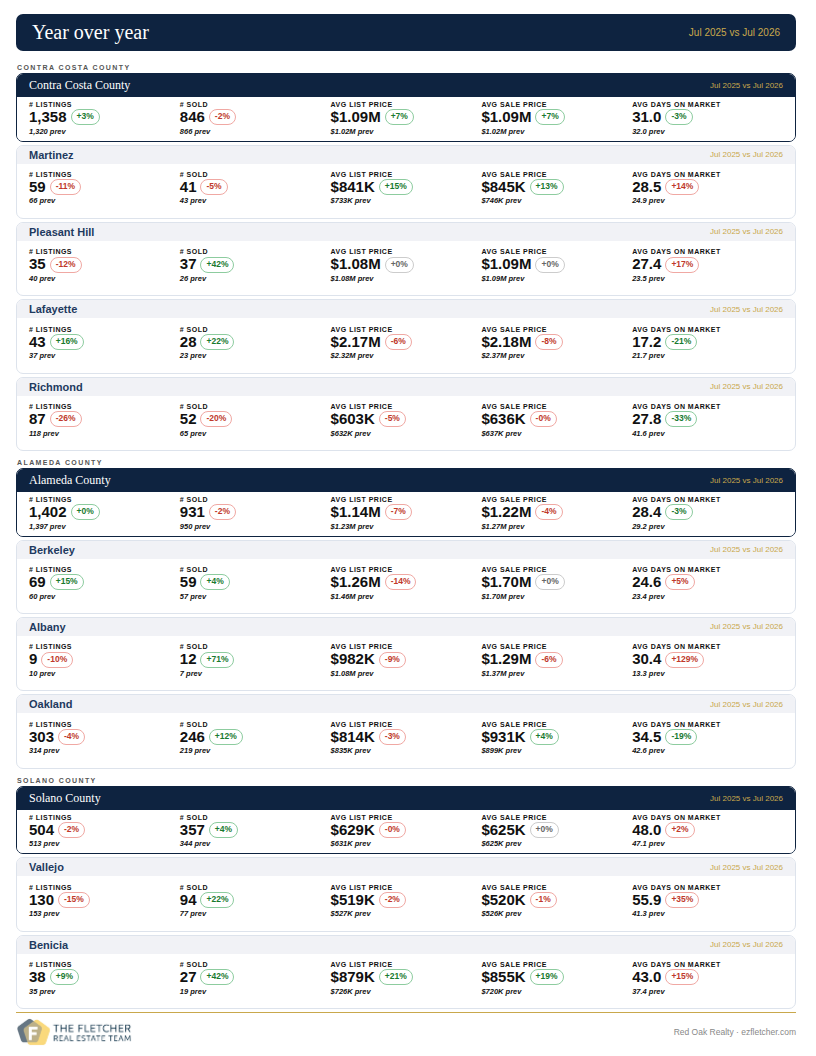
Year Over Year: July 2025 vs July 2026
This is the real story, and there's an interesting pattern in the data worth talking about.
Contra Costa County is outperforming Alameda County year over year. Contra Costa prices are up 7%, sales essentially flat, and days on market down 3%. Alameda County prices are down 4% year over year with sales also slightly off.
Total sold counts across both counties are nearly identical to last year. So the same number of buyers are transacting, but more of them are choosing Contra Costa over Alameda.
That's not an accident. Remote work permanently reduced the pool of buyers who prioritize a walkable urban condo over a house with outdoor space, and that shift is not reversing. Contra Costa offers more square footage, more yard, and more house for the dollar. Buyers increasingly consider Contra Costa zones where value stretches further, and the July numbers suggest that trend is showing up in closings. When total demand is flat but one county gains and another gives ground, that's a preference shift, not a market problem. EoandaCrezzio
At the city level, Richmond is this month's quiet standout. Listings are down 26% year over year, days on market are down 33%, and prices are essentially flat. That combination, less supply, faster sales, stable prices, is the definition of a market finding its floor. Richmond buyers who have been waiting for the right moment should pay attention.
Lafayette had a strong July year over year as well: sales up 22%, days on market down 21%. The luxury market in the Lamorinda corridor is healthier than it was a year ago.
In Solano County, Benicia continues to impress. Prices up 19% year over year, sales up 42%. That's two consecutive strong months for a city that wasn't on most buyers' radar a year ago. Vallejo had a mixed month: sales up 22% but days on market up 35%, suggesting more supply is coming to market faster than buyers are absorbing it.
Oakland improved meaningfully year over year: sales up 12%, days on market down 19%. The discount to Berkeley has widened, and buyers who are willing to trade walkability for value are finding more to like in Oakland than they did last summer.
What This Means For You
The market isn't hot and it isn't cold. It's sorting itself out by location and price point. Suburban Contra Costa is absorbing demand that urban Alameda used to capture. Richmond and Lafayette are outperforming. Benicia is a genuine story. Oakland is quietly recovering.
If you're a seller in Contra Costa or Solano, the current environment is working in your favor. If you're a seller in urban Alameda, pricing strategy matters more than it did a year ago.
Fall is when the market typically wakes back up after the summer pause. If you're thinking about buying or selling in any of our coverage areas, now is the right time to get a plan in place before activity picks up again.
Warmly,
Bill and Eli
The Fletcher Real Estate Team · Red Oak Realty
P.S. Curious where your neighborhood sits in all of this? We'll walk you through it. No pitch, just the numbers.
Eli Fletcher DRE #01933235 · Bill Fletcher DRE #01724665 · Red Oak Realty
