

June 2026 East Bay Real Estate Market Report
June looks strong. Here's why that's not the whole story, and why it's still good news.
Every summer the market slows. Families are traveling, school is out, and the urgency of spring fades. That seasonal softness is normal and expected. What makes this June different is what it's being compared to.
June 2025 was ugly. Mortgage rates were above 6.5% for most of last year, tariffs were hitting household budgets, DOGE cuts were creating real uncertainty about federal employment, and consumer confidence was shaky across the board. Buyers sat on their hands. Sellers stayed put. The East Bay market reflected all of it.
This June, things have normalized. Not improved dramatically, but stabilized. Rates are still elevated at around 6.5%, but buyers have adjusted their expectations. The tariff shock has been absorbed. People are making decisions again. That's why the year-over-year numbers look as good as they do.
Here's the full breakdown by city, month over month, May vs June 2026
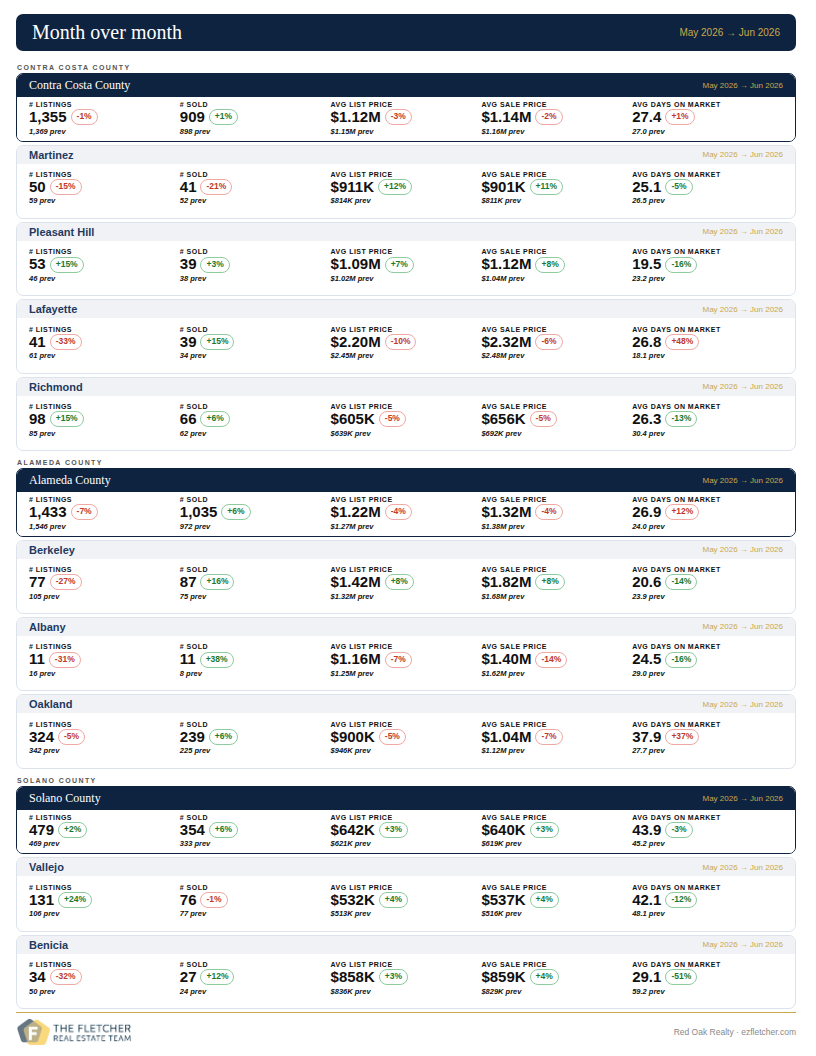
Month Over Month: May → June 2026
The seasonal pattern showed up as expected. Listings were flat to slightly down across all three counties, sales held steady, and prices eased modestly. The standouts worth noting: Benicia days on market dropped 51%, Lafayette days on market jumped 48% as luxury buyers slowed down, and Oakland DOM climbed from 28 to 38 days, giving buyers the most negotiating room they've had in the East Bay in some time.
And here is the year-over-year comparison, June 2025 vs June 2026
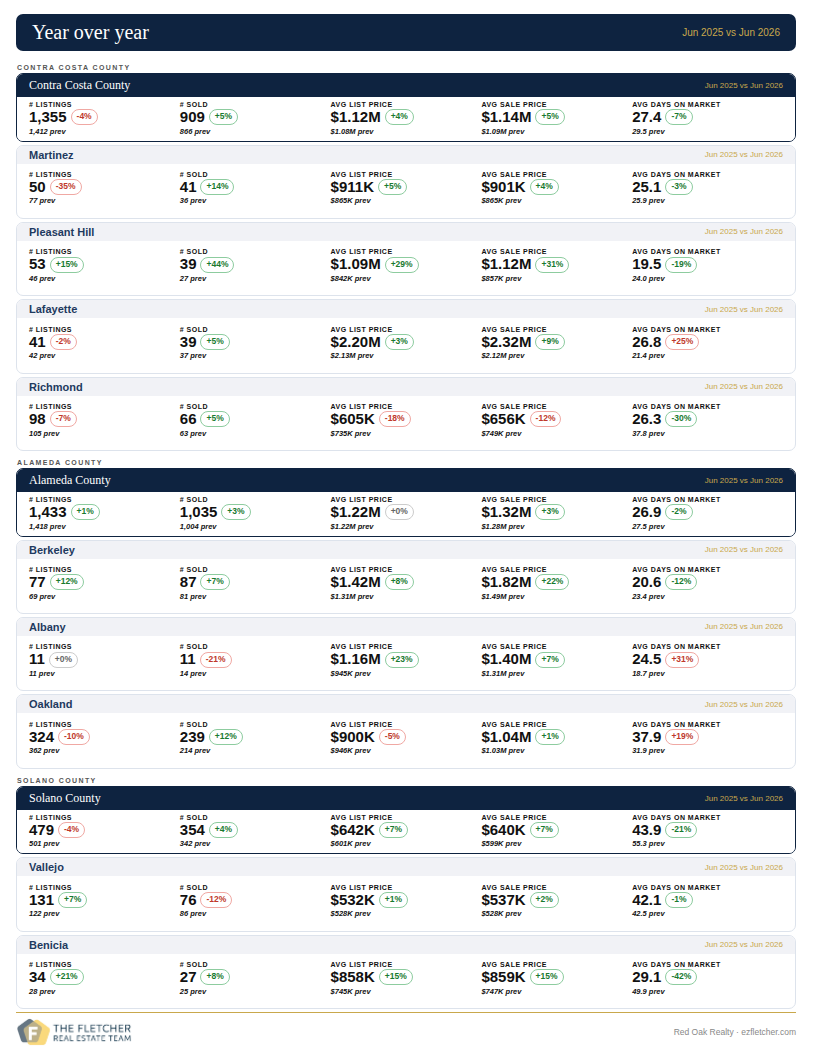
Year Over Year: June 2025 vs June 2026
This comparison tells the real story.
Against a June 2025 backdrop of rate-shocked buyers, tariff anxiety, and federal job uncertainty, this June looks meaningfully better across all three counties.
Contra Costa County: sales up 5%, prices up 5%, days on market down 7%. Pleasant Hill is the standout, with prices up 31%, sales up 44%, and days on market down 19%. Two consecutive months of exceptional data from a market that was underperforming a year ago. Berkeley is up 22% in sale price year over year, the strongest price appreciation of any city in our coverage area. Richmond sale prices are down 12% year over year, but days on market improved 30%. Fewer buyers in Richmond, but the ones who are there are transacting efficiently.
Solano County improved significantly year over year. Overall DOM dropped 21%, from 55 to 44 days, and prices are up 7%. Benicia's year-over-year transformation is the most dramatic in the data: prices up 15%, DOM down 42%.
What This Means For You
We're in a market that has stabilized after two difficult years. That's not the same as a hot market. It's more like a market that has remembered how to function. Buyers have adjusted to rates in the 6s. Sellers who priced realistically last spring are mostly under contract. The summer slowdown will keep things measured through August, and then we'll see what fall brings.
If you're thinking about buying or selling in Contra Costa, Alameda, or Solano County, call us. The data is local, the advice is specific, and we're happy to walk you through what it means for your situation.
Warmly,
Bill and Eli
The Fletcher Real Estate Team · Red Oak Realty
P.S. — If the news has you wondering what your home is worth in a market this uncertain, we’ll give you a straight answer. No pitch, no pressure. Just the number.
Eli Fletcher DRE #01933235 · Bill Fletcher DRE #01724665 · Red Oak Realty
