

Market Watch · May 2026
We were 23 days into a ceasefire when May started. We were 53 days in when it ended.
That context matters when you’re trying to read a real estate market.
The US-Iran ceasefire was signed April 8th — brokered at the last possible moment after 40 days of strikes, a near-shutdown of the Strait of Hormuz, and oil prices that had surged past $100 a barrel. By the time May began, we were on our third extension of a truce that both sides had already accused each other of violating. The Hormuz Strait — which handles roughly 20% of global energy supply — spent most of May partially blocked, with crude oil prices still elevated above $90 a barrel even after dropping nearly 20% from their peak.
Markets like certainty. Buyers like certainty even more. And what May offered was a ceasefire in name, while the underlying volatility — in oil, in inflation expectations, in the news cycle — remained very much alive.
We think that’s part of what you’re seeing in the listing numbers.
The 44-Day Window
Before we get into the numbers, a quick note on how to read them. April closing data reflects homes that hit the market roughly 44 days earlier. Here's the math: approximately 14 days of active marketing before an offer is accepted, followed by a 30-day escrow. That means most of what closed in April was listed in mid-to-late February and early March.
What you're seeing in this month's data isn't the summer market arriving. It's early spring resolving. And that math works in reverse too. If you're thinking about listing, your average days on market plus a 30-day escrow tells you exactly when your home needs to go live to hit your target closing date. Albany is closing in 12 days — meaning a seller there needs to go live just six weeks before their target close. Martinez at 34 days needs nearly two months of runway. Same county, very different timelines. We can work backwards from any date you have in mind.
Here's the full breakdown by city — month over month, April vs May 2026
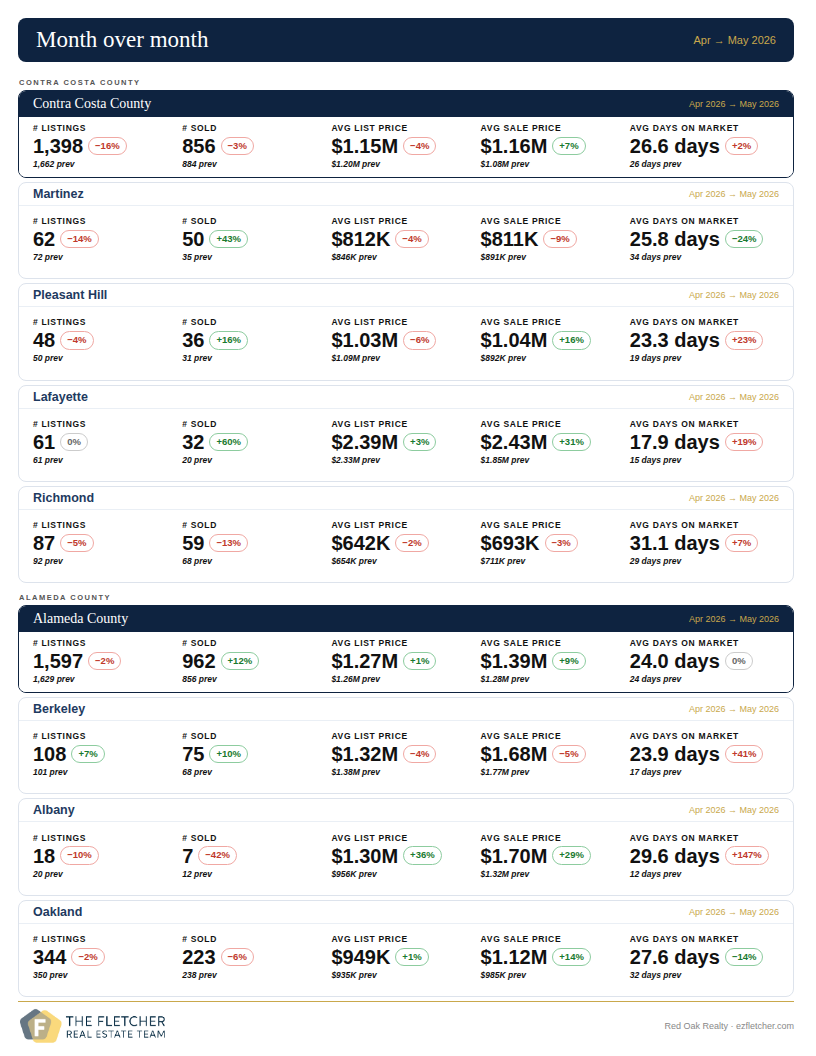
Month Over Month: April → May 2026
Contra Costa County saw listings fall 16% from April to May — from 1,662 to 1,398 — while sales held and prices actually climbed. Average sale price rose 7% month over month to $1.16M. Days on market improved slightly. The county is doing more with less inventory, which is a seller’s market signal even if it doesn’t feel like one.
Martinez had a strong rebound month. Sales jumped 43% — from 35 to 50 — and days on market dropped sharply from 34 to 26. Prices pulled back 9% to $811K, but the velocity tells a better story than the price line. Homes are moving.
Pleasant Hill saw sales climb 16% and prices jump to $1.04M, up from $892K in April. The one caution: days on market ticked up from 19 to 23, suggesting the April pace was unusually fast rather than this month being slow.
Lafayette had its best sales month in our data — 32 homes sold versus just 20 in April, a 60% increase. Average sale price moved to $2.43M. As always with Lafayette, the small sample means mix matters more than trend, but the volume is notable.
Richmond cooled from a strong April. Sales fell 13% and prices eased 3% to $693K. Days on market crept up to 31. It remains a steady market, just not the standout it was a month ago.
Alameda County listings were essentially flat month over month — 1,597 versus 1,629 — while sales surged 12% to 962. Average sale price rose 9% to $1.39M. The county absorbed more buyers with the same inventory, which pushed prices up.
Berkeley slowed slightly — prices dipped 5% to $1.68M and days on market jumped from 17 to 24. Still one of the fastest markets in the East Bay, but the April pace was exceptional.
Oakland was the standout: prices climbed 14% to $1.12M and days on market tightened from 32 to 28. Oakland is gaining ground.
Albany’s 7 sales make any analysis tentative, but the price appreciation — up 29% to $1.70M — reflects real demand in a market with almost no supply.
And here is the year-over-year comparison, May 2025 vs May 2026
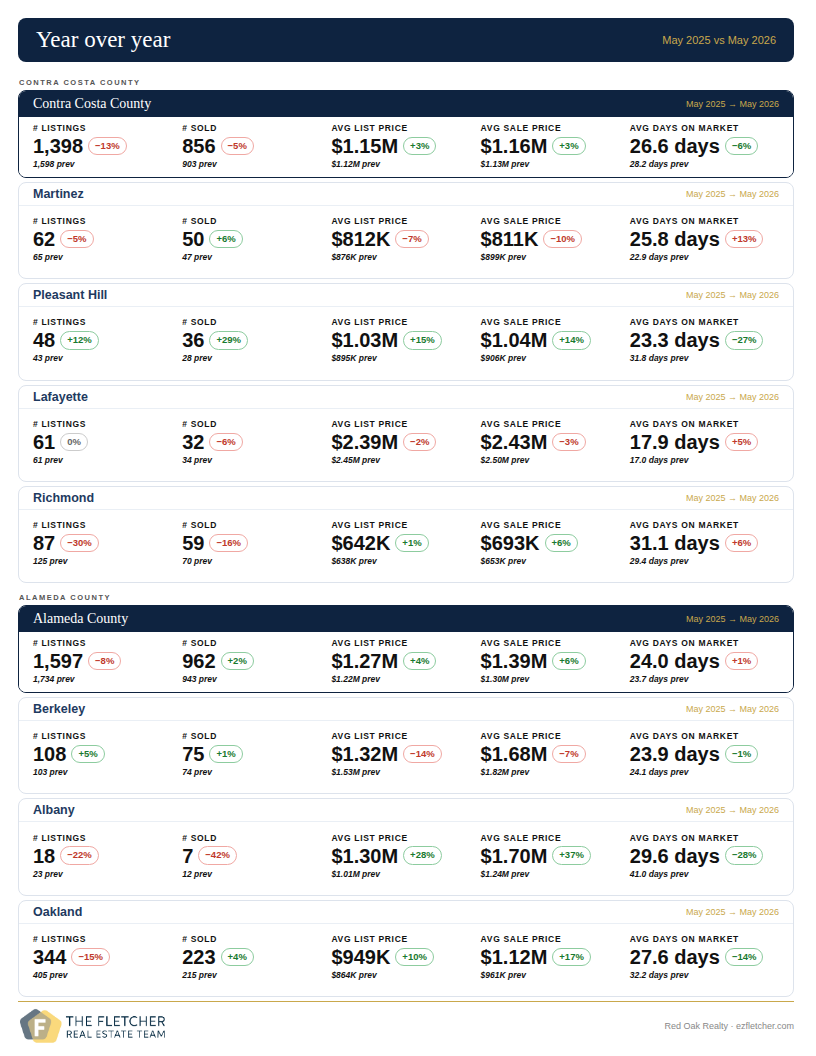
Year Over Year: May 2025 vs May 2026
This is where the geopolitical story gets clearest.
Contra Costa County: listings are down 13% year over year — 1,398 this May versus 1,598 last May. Alameda County is down 8% — 1,597 versus 1,734. Across both counties, roughly 337 fewer homes hit the market compared to the same month last year.
That’s not a seasonal pattern. That’s uncertainty keeping sellers on the sideline.
And yet prices are holding. Contra Costa sale prices are up 3% year over year. Alameda is up 6%. Fewer sellers, stable demand, prices supported. The East Bay is not cratering — it is compressing.
At the city level, the strongest year-over-year stories are Pleasant Hill and Oakland. Pleasant Hill is up 14% in price, 29% more sales, and days on market dropped 27% — from 31.8 days last May to 23.3 this year. That’s a market that has genuinely improved in 12 months. Oakland is up 17% in price year over year with more sales closed and faster absorption. Both markets are outperforming their 2025 versions by meaningful margins.
Martinez is the one area of concern year over year. Prices are down 10% from May 2025 and days on market are up 13%. The velocity improvement we saw month over month is real, but sellers should understand they’re operating in a softer market than last year.
What This Means For You
The ceasefire held through May — barely, and with ongoing strikes, disputes over the Strait, and oil prices still elevated. We expect that as a genuine long-term resolution takes shape, buyer sentiment will improve and some of the sellers sitting on the sidelines will begin to move. When that happens, inventory will rise, and the pricing pressure that’s been supporting values in low-inventory markets will ease somewhat.
That window — right now, before that happens — is one of the better times to list in recent memory. You’re competing against very little, and demand hasn’t gone anywhere.
If you’re thinking about buying or selling anywhere in the East Bay and want a straight read on where your specific neighborhood sits in all of this — call us.
Warmly,
Bill and Eli
The Fletcher Real Estate Team · Red Oak Realty
P.S. — If the news has you wondering what your home is worth in a market this uncertain, we’ll give you a straight answer. No pitch, no pressure. Just the number.
Eli Fletcher DRE #01933235 · Bill Fletcher DRE #01724665 · Red Oak Realty