

Market Watch · April 2026
The market woke up in April. But before you read too much into it — here's what the numbers are actually telling us:
Every spring, closing data arrives and the headlines do what headlines do. Prices jumped. Sales surged. The market is back. And yes — the numbers are real. But so is the context behind them, and that context changes everything.
Here's what we saw across Contra Costa and Alameda Counties this month, and what we think it actually means for you.
The 44-Day Window Nobody Talks About
Before we get into the numbers, a quick note on how to read them. April closing data reflects homes that hit the market roughly 44 days earlier. Here's the math: approximately 14 days of active marketing before an offer is accepted, followed by a 30-day escrow. That means most of what closed in April was listed in mid-to-late February and early March.
What you're seeing in this month's data isn't the summer market arriving. It's early spring resolving. And that math works in reverse too. If you're thinking about listing, your average days on market plus a 30-day escrow tells you exactly when your home needs to go live to hit your target closing date. Albany is closing in 12 days — meaning a seller there needs to go live just six weeks before their target close. Martinez at 34 days needs nearly two months of runway. Same county, very different timelines. We can work backwards from any date you have in mind.
Here's the full breakdown by city — month over month, March vs April 2026
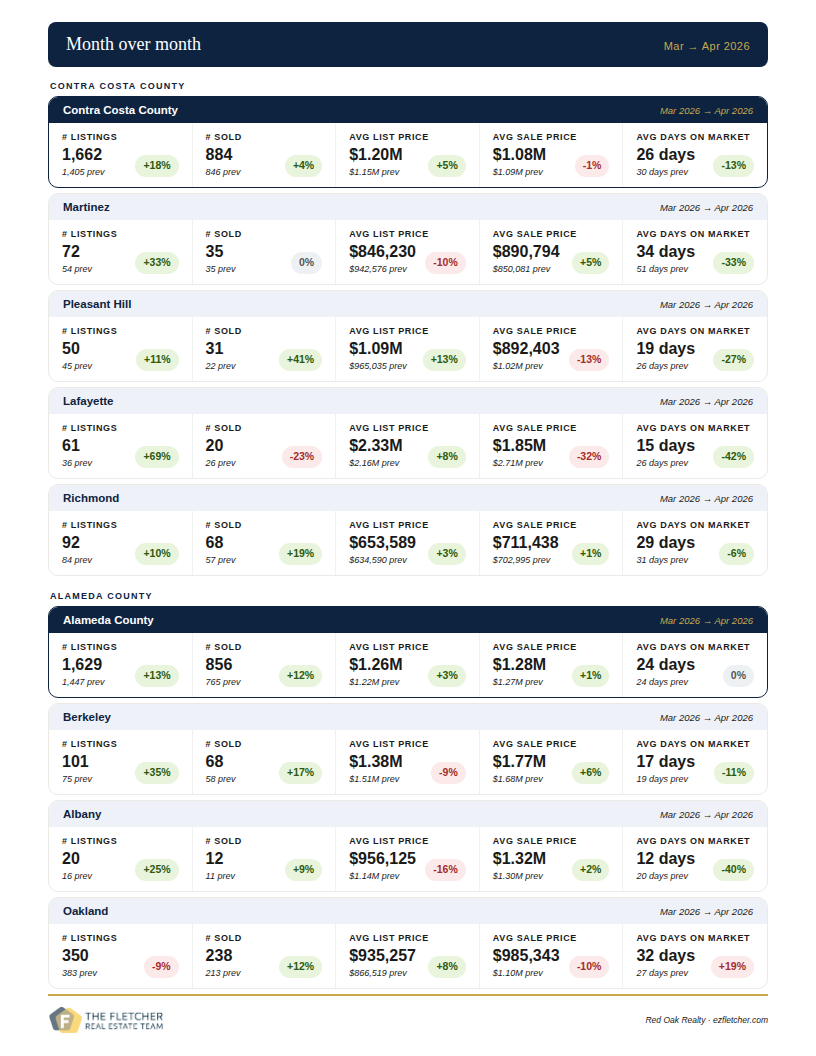
Month Over Month: March → April 2026
Contra Costa County added 257 new listings in April — up 18% from March — and closed 884 sales, a 4% increase. Average sale price slipped slightly from $1,093,470 to $1,083,832, down 1%. Days on market improved from 30 to 26. On balance, a healthy, active market.
The city-level data tells a more detailed story.
Martinez saw listings jump 33% to 72 active homes while the number of sales held flat at 35. Average sale price ticked up 5% to $890,794 and days on market dropped significantly — from 51 days in March to 34 in April. Martinez is moving in the right direction, but sellers need to understand that 34 days is still a longer runway than most of the county.
Pleasant Hill had a strong volume month with 41% more homes sold — but average sale price fell 13% month over month to $892,403. Days on market improved to 19 days. More activity, lower prices — the market is absorbing more inventory but buyers are getting better deals.
Lafayette is Lafayette. Average sale price came in at $1,849,444 in April, down 32% from March's $2,709,038. With only 20 homes sold, one or two fewer high-end closings shifts the average dramatically in either direction. Lafayette's year-over-year list price is essentially flat at +1%, which is the more reliable read on where that market actually sits.
Richmond was quietly one of the better stories in the county. Sales up 19%, sale prices up 1%, and days on market down to 29 from 31. Steady and consistent.
Alameda County added 182 listings month over month and closed 856 sales — up 12%. Average sale price held essentially flat at $1,275,406. Days on market unchanged at 24. The county as a whole is stable.
Berkeley's average sale price climbed 6% to $1,773,265 with days on market continuing to tighten at just 17 days. Berkeley remains one of the fastest-moving markets in the East Bay.
Albany's sale price rose 2% to $1,324,084 with homes now selling in just 12 days — down from 20 in March. Small sample size, only 12 sales, but the pace is notable.
Oakland added 25 more sales month over month but average sale price dropped 10% to $985,343 and days on market increased from 27 to 32. Oakland is the one market in our coverage area where buyers are gaining ground right now.
And here is the year-over-year comparison, April 2025 vs April 2026
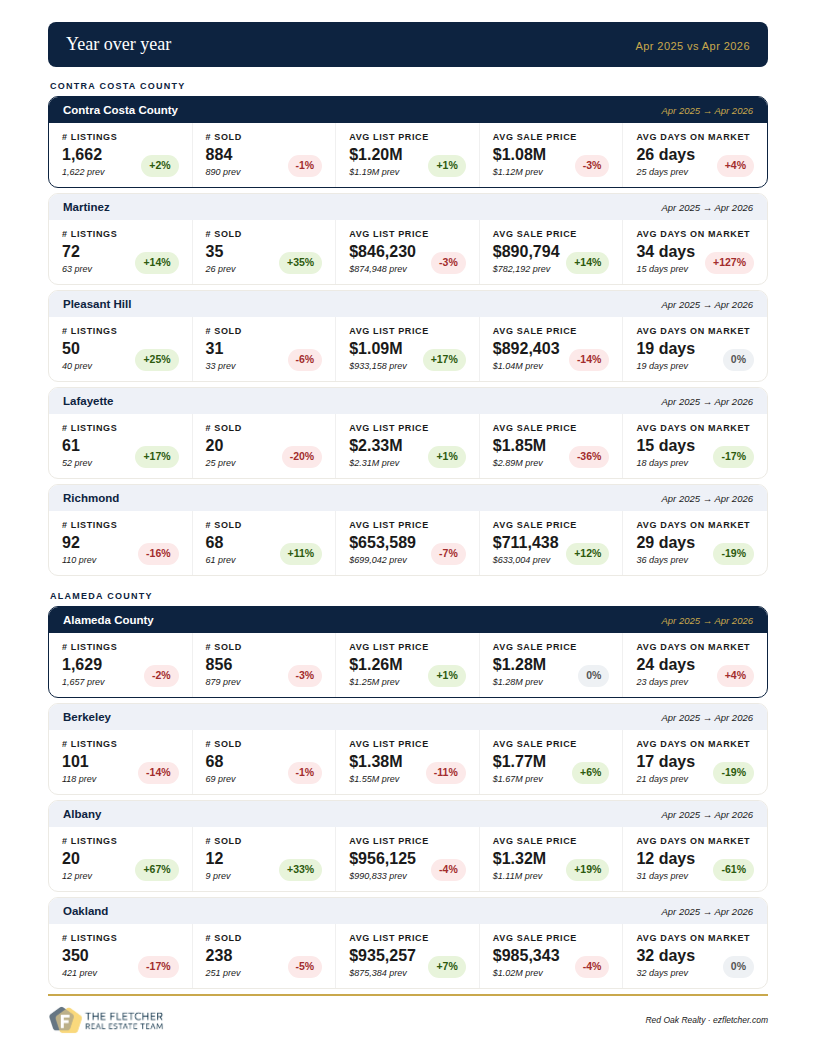
Year Over Year: April 2025 vs April 2026
This is the data that matters most. It filters out seasonal noise and shows you the real trajectory of each market.
Contra Costa County: listings up 2%, sales essentially flat at -1%, average sale price down 3% to $1,083,832, days on market up slightly from 25 to 26. A softer market than this time last year, but not dramatically so.
Martinez is the year-over-year standout — sale prices up 14% to $890,794 with 35% more homes sold. The challenge is days on market, which jumped from 15 days last April to 34 this year. Homes are selling for more but taking longer to get there. Pricing matters more than ever in this market.
Pleasant Hill is in the opposite position — sale prices down 14% year over year to $892,403, listings up 25%, and days on market flat at 19 days. More inventory, lower prices, faster sales. A buyer's market within the broader county.
Lafayette year over year: list price essentially flat, sale price down 36% — but as noted above, this is a small-sample luxury market where the mix of homes sold in any given month drives the average more than underlying demand does.
Richmond is one of the cleanest positive stories in the data. Sale prices up 12% year over year to $711,438, listings down 16% creating tighter supply, and days on market down from 36 to 29. Demand is outpacing supply in Richmond.
Alameda County year over year: listings down 2%, sales down 3%, prices essentially flat. The county is holding its value but the volume story is softer than last year.
Berkeley sale prices up 6% year over year to $1,773,265 with days on market tightening from 21 to 17. Berkeley buyers are moving fast and paying more than last year.
Albany sale prices up 19% year over year to $1,324,084 — the strongest price appreciation in our coverage area — with days on market dropping dramatically from 31 to 12. Albany is outperforming.
Oakland sale prices down 4% year over year to $985,343, with listings down 17% and volume down 5%. The market is contracting slightly. Days on market flat at 32.
What This Means For You
The Bay Area is not in freefall and it is not surging. It is a market sorting itself out by neighborhood, and the difference between a good outcome and a frustrating one right now comes down to precision — pricing right, timing right, and understanding which direction your specific market is moving.
Richmond and Albany are outperforming. Berkeley is tight and competitive. Oakland is giving buyers more room than it has in years. Martinez is appreciating but slower. Pleasant Hill has more supply than buyers.
If you're thinking about buying or selling anywhere in Contra Costa or Alameda County and want a straight read on your specific situation — call us. That's what we're here for.
Warmly,
Bill and Eli
The Fletcher Real Estate Team · Red Oak Realty
P.S. — Curious what your home is worth in this market? Give us a call. We'll give you a straight answer.
Eli Fletcher DRE #01933235 · Bill Fletcher DRE #01724665 · Red Oak Realty
